Reporting
Generate and send reports
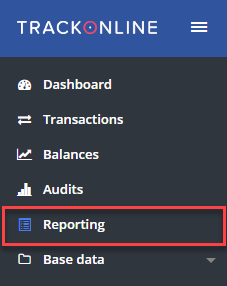
Reporting is a feature in TrackOnline that allows you to generate different reports. You can find reporting on the left side of your screen, as shown in the image: 'Reporting' below.
Reporting
The reports that are currently available are:
- Balance per location
- Balance per location hierarchy
- Transactions per carrier
- Transactions per contractor
- Transactions per location
- Transactions per trip
Each of the different reports will be discussed in detail.
If you click on reporting, you will see a new screen as shown in the image below: 'Reporting overview'.
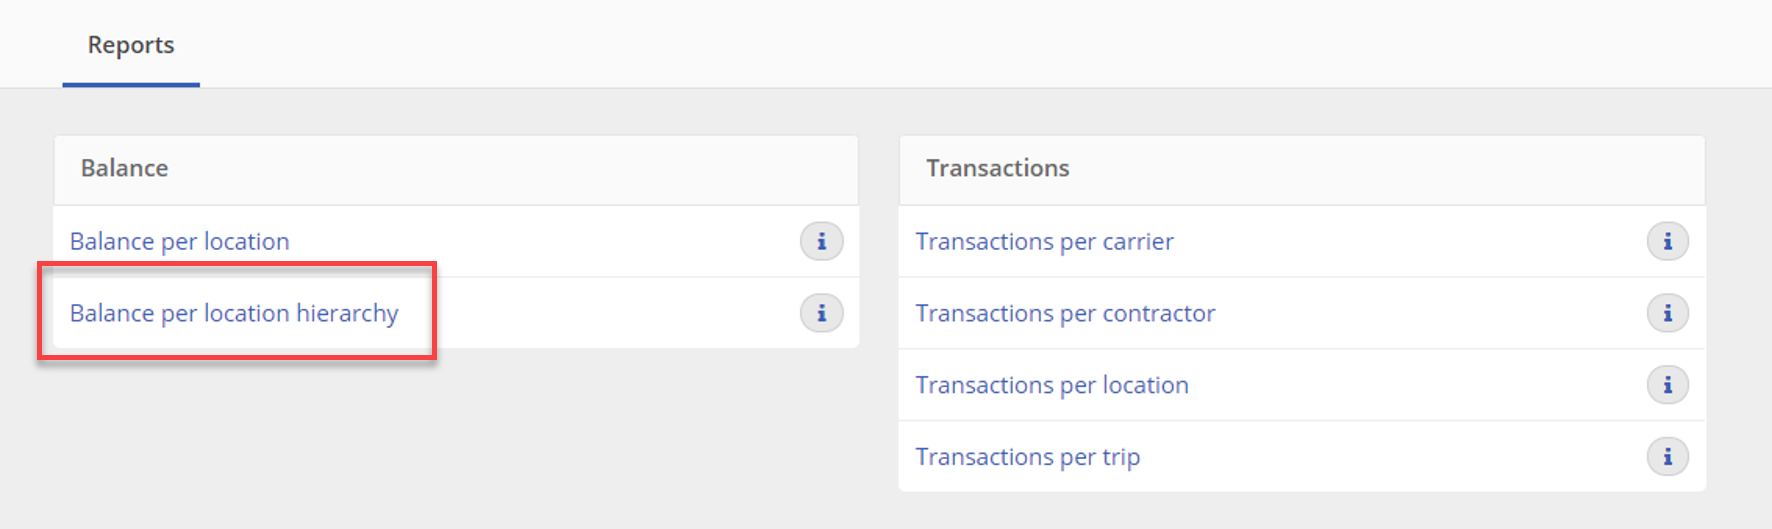
Reporting overview
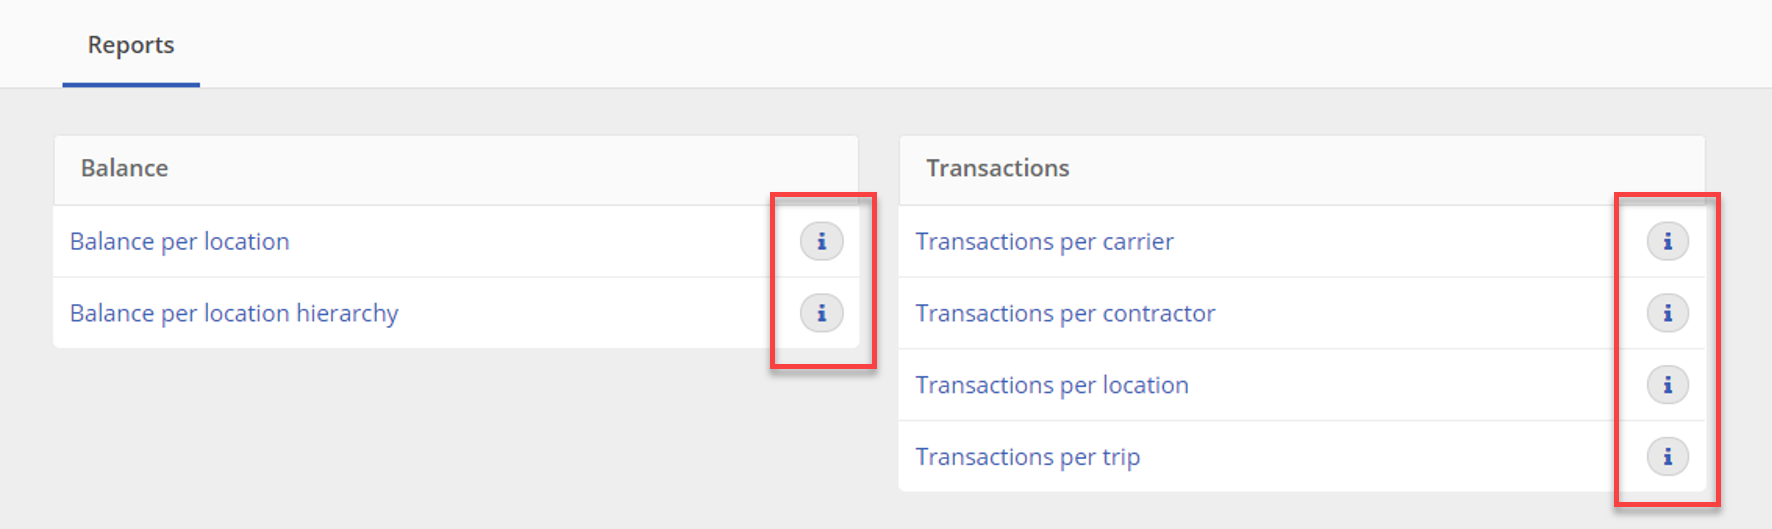
Here you can either choose to see the balance per location or location hierarchy and the transactions per carrier, contractor, location or trip.
If you want to know more about each of these reports, you can click on the information button. These are the 'ℹ️' buttons which are indicated with the red frames in the image above. Clicking on these buttons, gives you more detailed information.
Report: Balance per location
The report 'Balance per location' allows you to view the balance of all the items and/or specific items that a location has. The report allows you to view the balance of a single location or the balance of multiple locations at once.
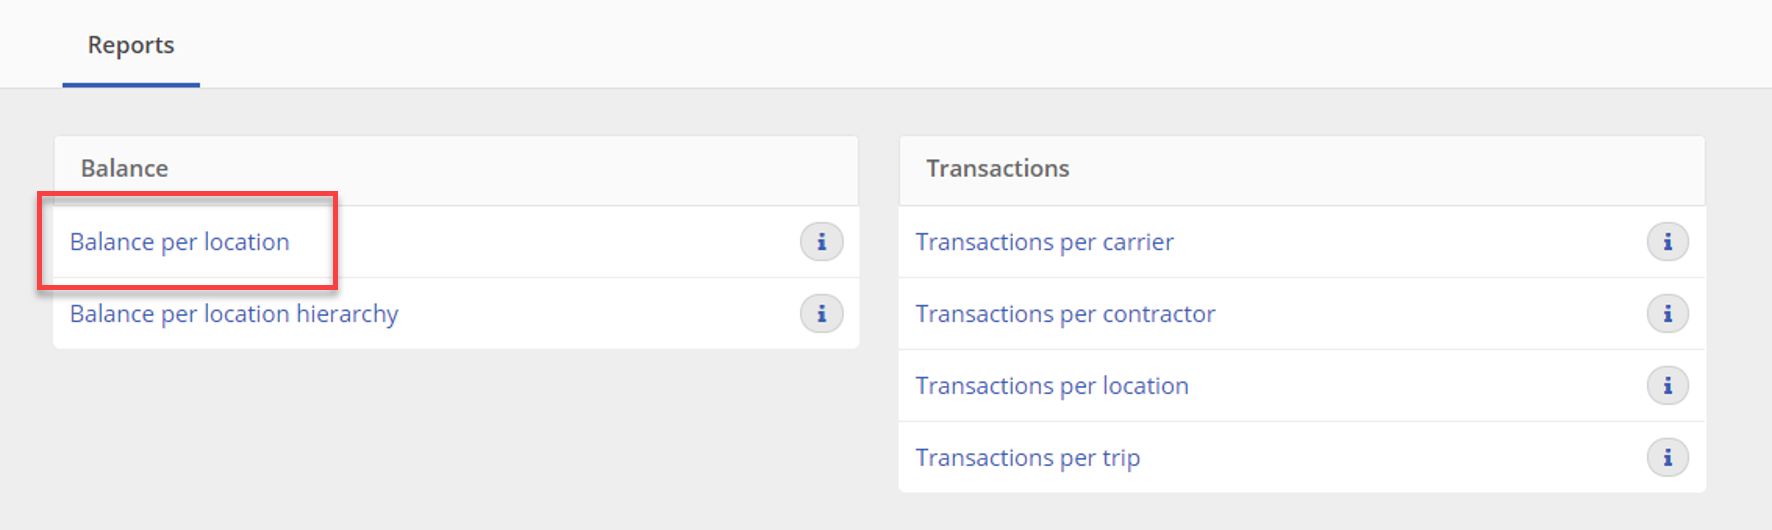
To view this report, click on 'balance per location', as shown in the image: 'Balance per location' below. At the end of this paragraph we will explain the contents of the actual report, in the header: 'Example report Balance per location'.
Balance per location
When you have clicked on the report 'Balance per location' you will see an overview with multiple filters. This allows you to filter your results in order to make your research more specific and to create the best possible reports. Each of the filters will be explained in more detail in the next paragraph.
Filters
To create the best possible reports, you can use multiple filters. In the image below these filters are indicated with different numbers. Under the image, each of the options are described.
Reporting filters
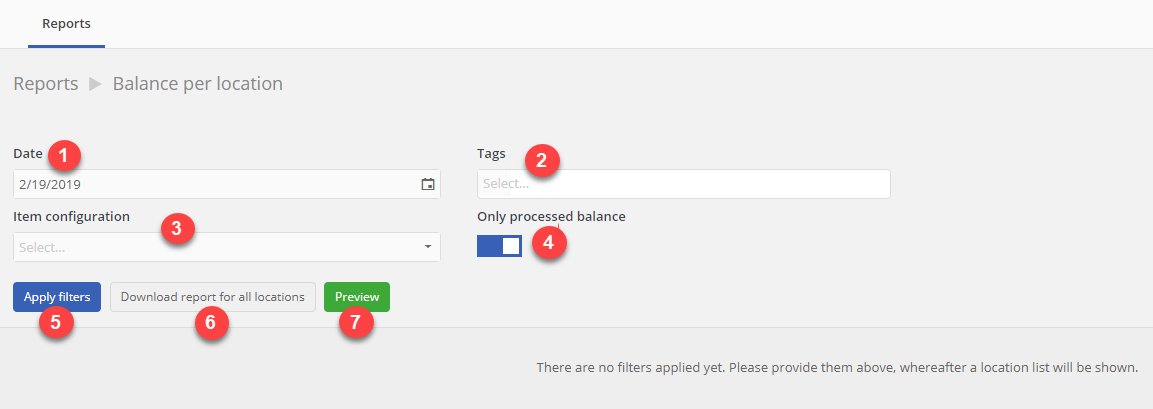
Filter options:
- Date: The date here indicates until when the report should show the data.
- Tags: The tags are attached to locations. When you filter on a tag, you will only see those locations that have been attached to that tag.
- Item configuration: Here you can filter your reports based on item configurations. Then only the locations with the relevant items are shown (e.g. you only want to see a report of a specific plastic crate).
- Only processed balance: This switch currently indicates that only processed balances will be shown on the report. This means that only balances built up by processed transactions in TrackOnline are shown.
- Apply filters: When you press this button, you see an overview of all the locations in the administration based on the set filters. From here you can select the locations where you want to create a report for. See the image below.
Select locations for reporting
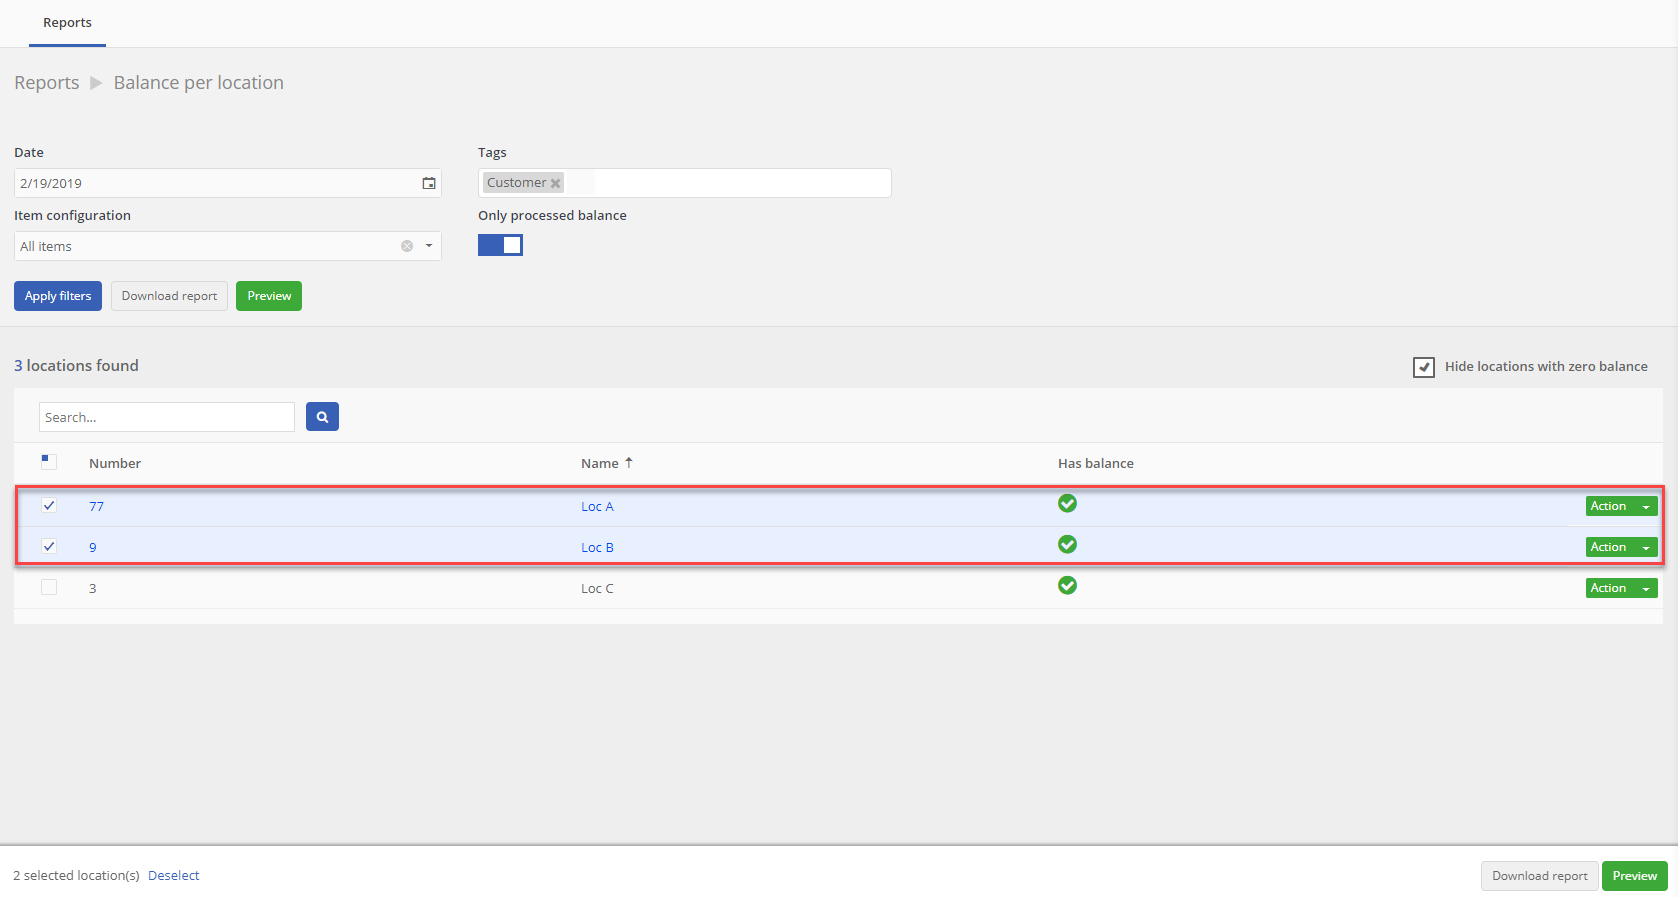 In this example image you see the locations A, B and C. We only want to create a report of the locations A and B. That is why we switched the checkbox of these locations to 'on'.
- Download report for all locations: When you press this button, TrackOnline will generate a report with all the existing locations in TrackOnline.
- Preview: When you select this button, you will see a preview of the (selected) locations in TrackOnline. After viewing the preview, you can decide if you want to download the report.
Example report
Below you can see an example of a report 'Balance per location'. The most important areas are marked with colored frames. Description per frame is given below the image.
Note:
You can generate reports with locations of your choice and make combinations that are suitable for your process.
Example report - Balance per location
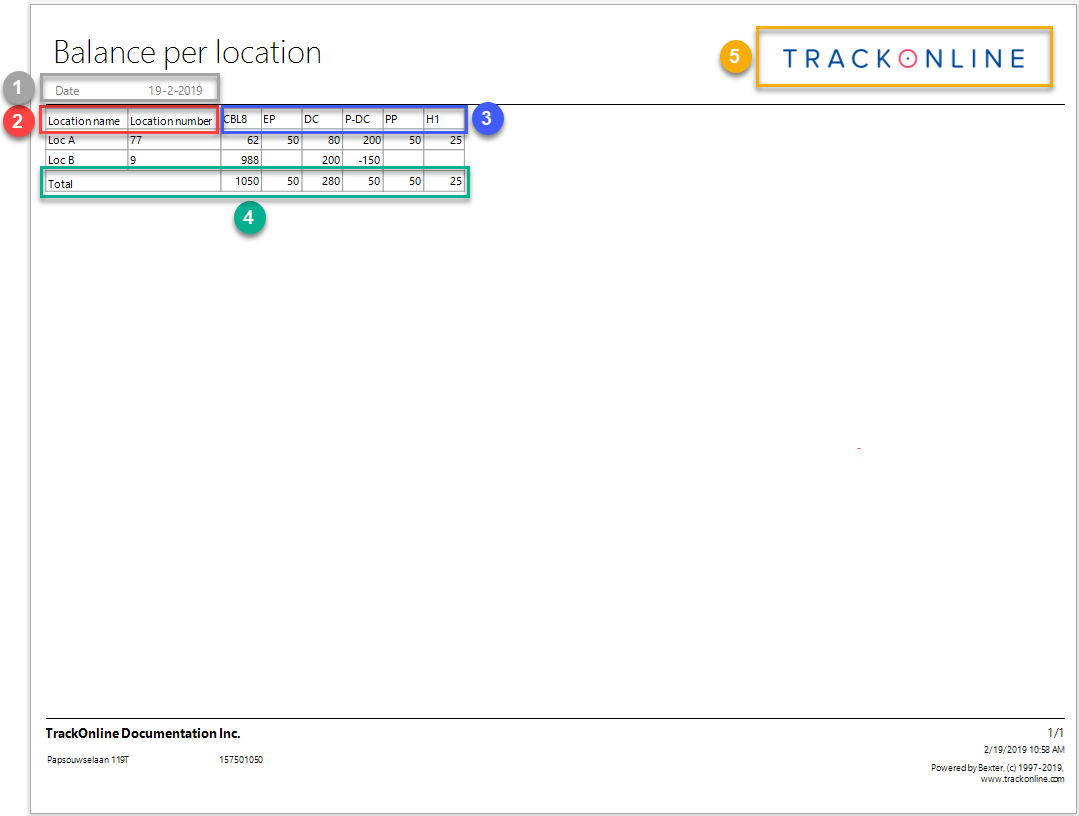
- Date: Here you can see the date for this specific report, as you can see it is set on 19-2-2019;
- General headers: Here you can see the location name and location number. This way you can identify your locations based on number and/or name;
- Item headers: Here you can see the items per column;
- Total: Here you can find the total amounts for each item/column;
- Logo Here you see your company logo. In this example the logo of TrackOnline is shown. Note that you can put your own company logo here, via 'Configuration' > 'Administration settings' > 'Company logo'.
Report: Balance per location hierarchy
The report 'Balance per location hierarchy' allows you to view the balance of all the items and/or specific items for an entire (or partial) location hierarchy.
To view this report, click on 'Balance per location hierarchy', as shown in the image below.
Balance per location hierarchy
When you have clicked on the report 'Balance per location hierarchy' you will see an overview with multiple filters. This allows you to filter your results in order to make your research more specific and to create the best possible reports. Each of the filters will be explained in more detail in the next paragraph.
Filters
To create the best possible reports, you can use multiple filters. In the image below these filters are indicated with different numbers. Under the image each of the options are described.
Reporting hierarchy filters
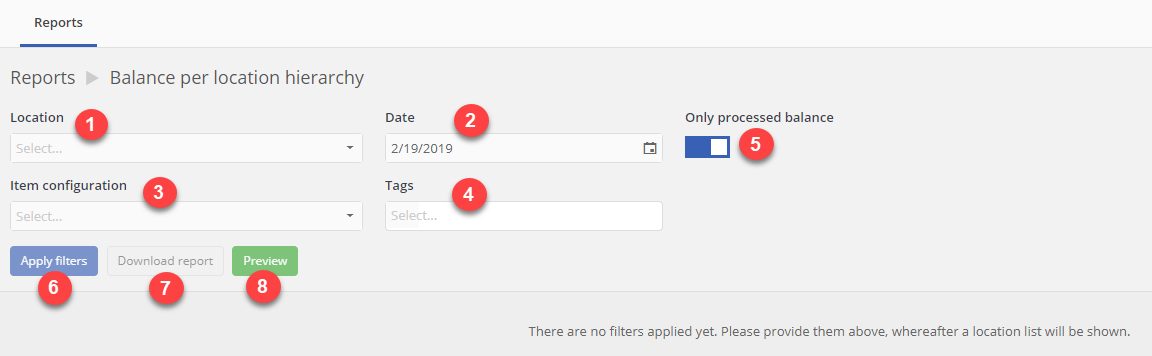
Filter options:
- Location: Here you can select the location of which you want to see the hierarchy and balance of.
- Date: The date here indicates until when the report should show the data.
- Item configuration: Here you can filter your reports based on item configurations. Then only the locations with the relevant items are shown (e.g. you only want to see a report of a specific plastic crate).
- Tags: The tags are attached to locations. When you filter on a tag, you will only see those locations that have been attached to that tag.
- Only processed balance: This switch currently indicates that only processed balances will be shown on the report. This means that only balances built up by processed transactions in TrackOnline are shown.
- Apply filters: When you press this button, you see an overview of all the locations in the administration based on the set filters.
- Download report: When you press this button, TrackOnline will generate a report with all the selected locations in TrackOnline based on hierarchy.
- Preview: When you select this button, you will see a preview of the (selected) locations in TrackOnline. After viewing the preview, you can decide if you want to download the report.
Example report
Below you can see an example of a report 'Balance per location hierarchy'. The most important areas are marked with colored frames. Description per frame is given below the image.
Example report - Balance per location hierarchy
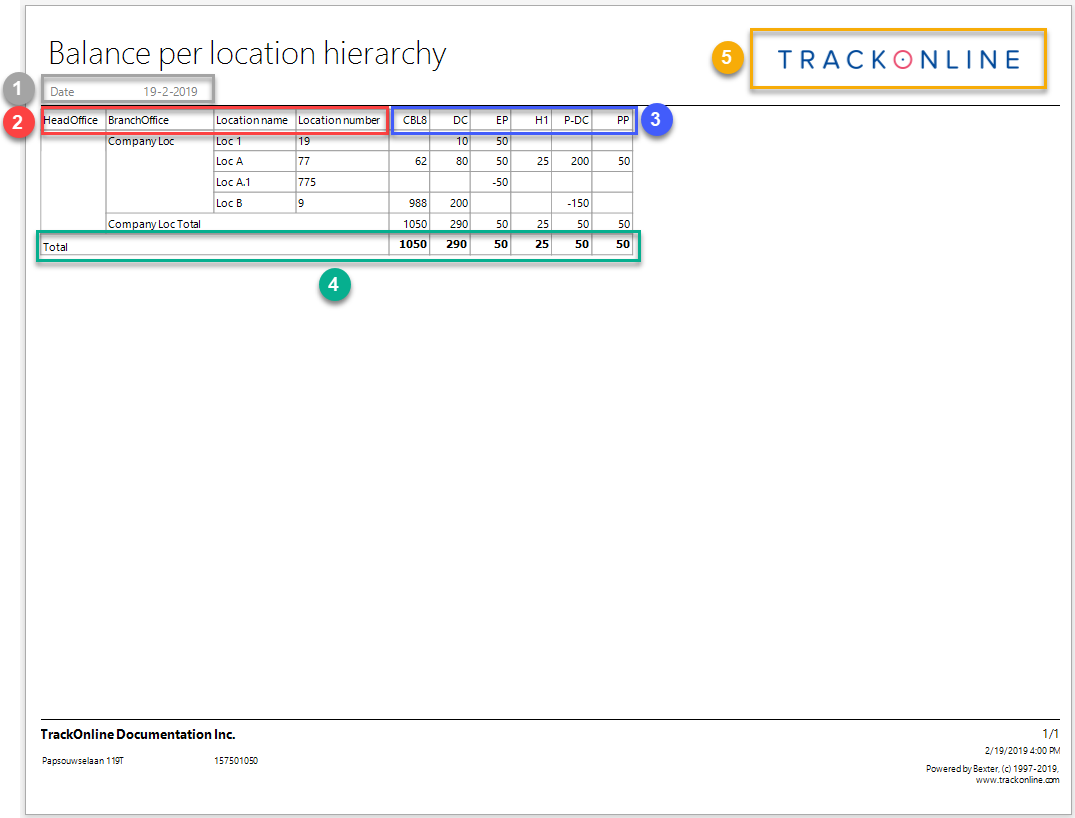
- Date: Here you can see the date for this specific report, as you can see it is set on 19-2-2019;
- General headers: Here you can see the location types, location names and location numbers. This way you can identify your locations based on type, number and/or name;
- Item headers: Here you can see the items per column;
- Total: Here you can find the total amounts for each item/column;
- Logo Here you see your company logo. In this example the logo of TrackOnline is shown. Note that you can put your own company logo here, via 'Configuration' > 'Administration settings' > 'Company logo'.
Transaction reports
The transaction reports allow you to view the transactions that have been made with a specific carrier, contractor, location or trip. In one overview you can view the transactional history.
To view these reports, click on one of the reports as shown below. At the end of this paragraph we will explain the contents of the actual report, in the header: 'Example report'. 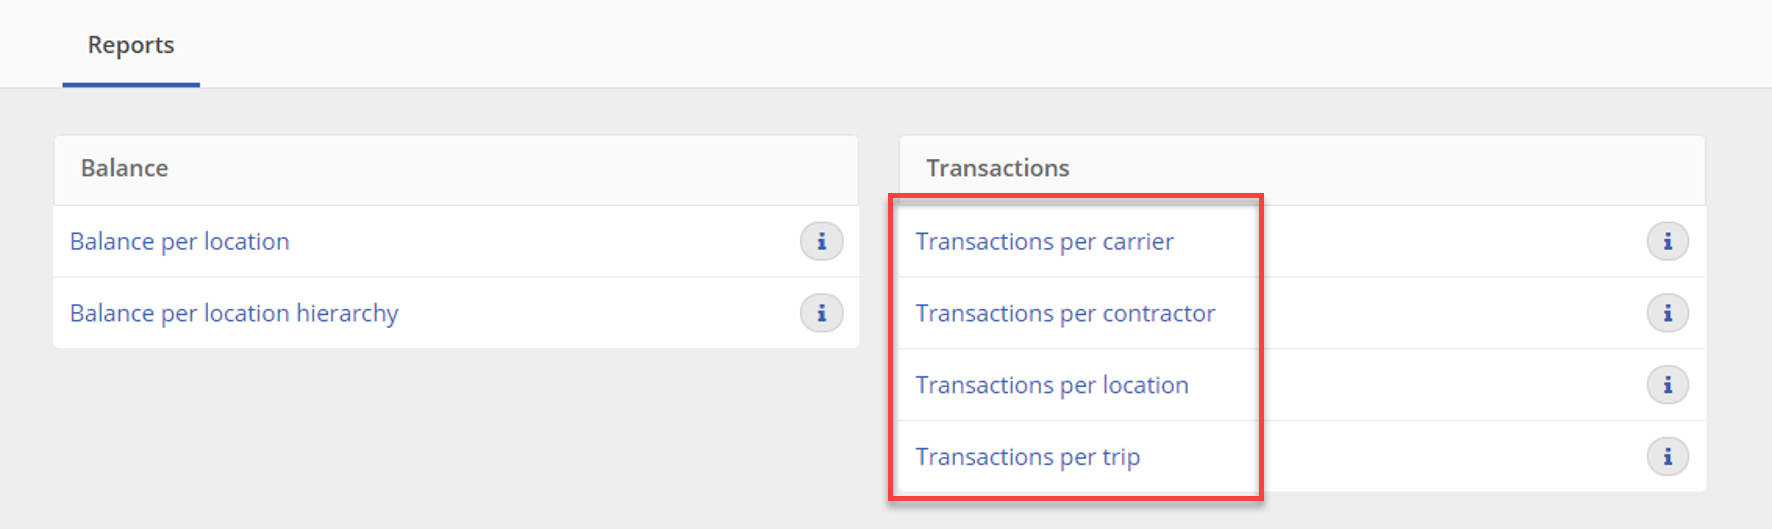
Once you have clicked on the report of your choice, you will see an overview with multiple filters. This allows you to filter your results in order to make your research more specific and to create the best possible reports. The overview and the filters will be explained in the next paragraph.
Report overview & filters
Every report in TrackOnline has the ability to filter information in order to make your research more specific and to create the best possible reports.
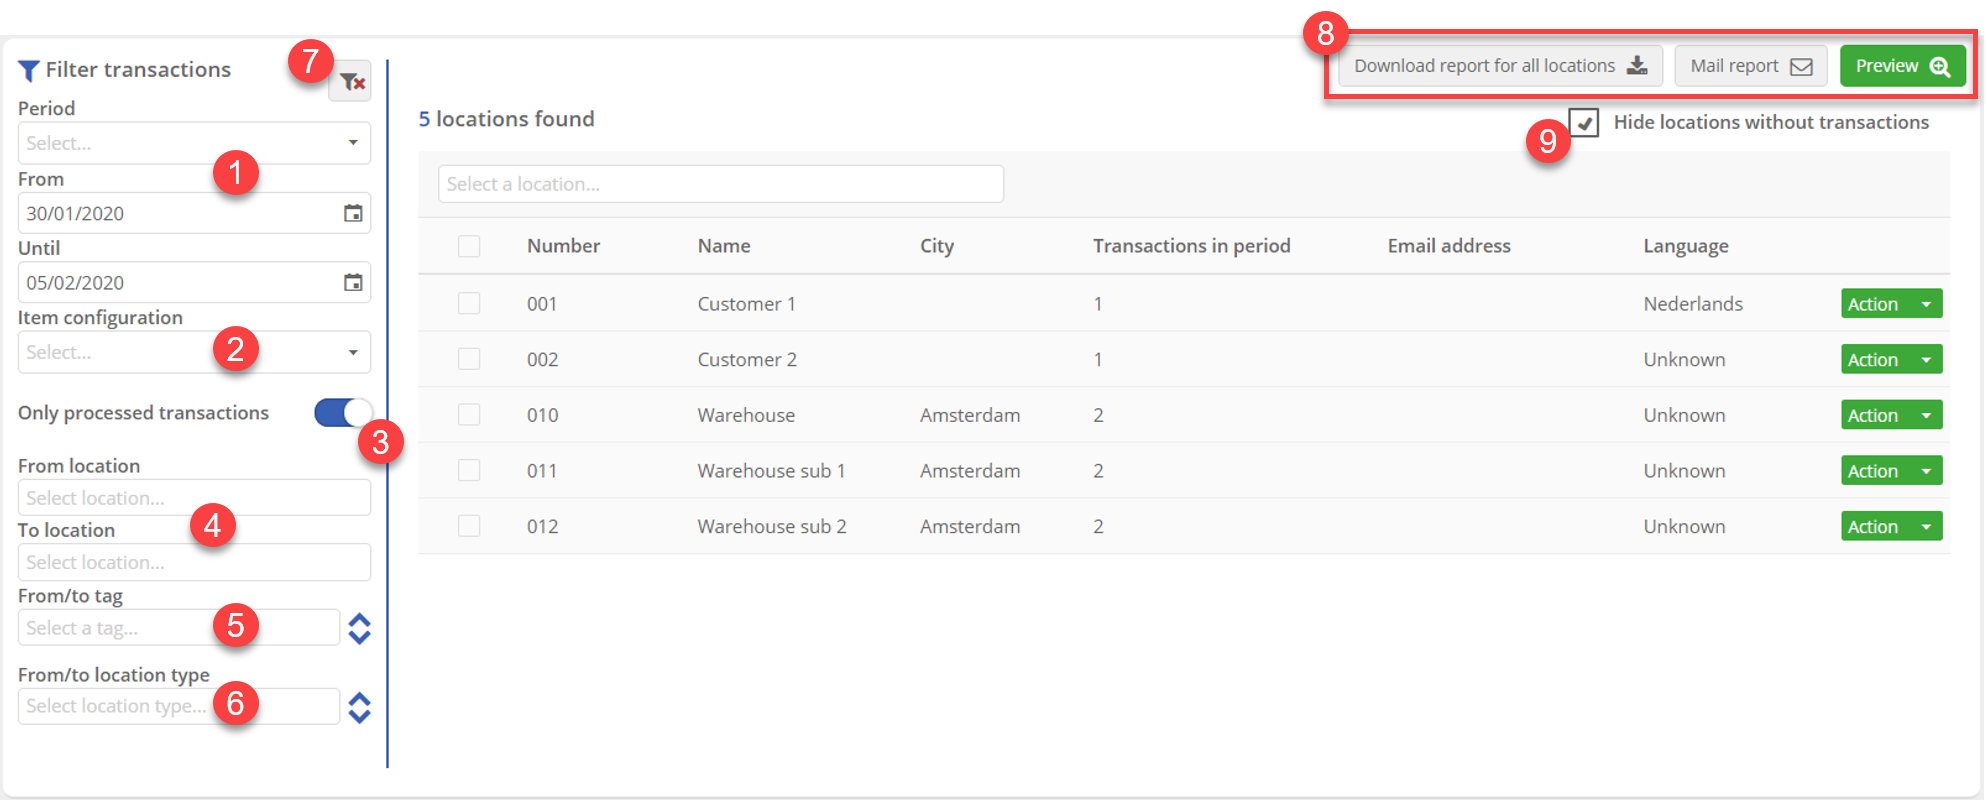
- Here you can select the reporting period either from the drop-down list called
Periodor by selecting your own 'From' and 'Until' dates. - Here you can select an item configuration. This field will automatically be filled in with your last item configuration if you have already made reports. To learn more about item configurations, click HERE.
- Click on this switch to select transactions that only have the status
Processedor not. - Here you can select the departure and arrival locations of the transactions you want to see.
- Here you can select tags applied to departure or arrival locations. Furthermore, you can click on
 to dissociate departure and arrival locations. This way you will be able to select different tags for to and from locations.
 - Here you can select departure or arrival location types. Furthermore, you can click on to dissociate departure and arrival locations. This way you will be able to select different types for to and from locations.
- Here you can reset the filters.
- Here you can, from left to right, download the report in PDF format, directly email it to someone or preview it. Emailing will let you choose the template of the email and will send it the concerned locations with an email address filled in. The report will be translated to the location's language. You will be able to print the report from the preview screen or to save it in various formats.
- Here you can choose to show or hide the locations without any transactions available for the applied filters.
Note!
The report that is sent by email, will be translated in the language of the location that you've selected. The language of the preview report can therefore differ from the report that is actually sent!
Example report
Below you can see an example of a report 'Transactions per location'. The most important areas are marked with colored frames. Description per frame is given below the image.
Example report - Transactions per location
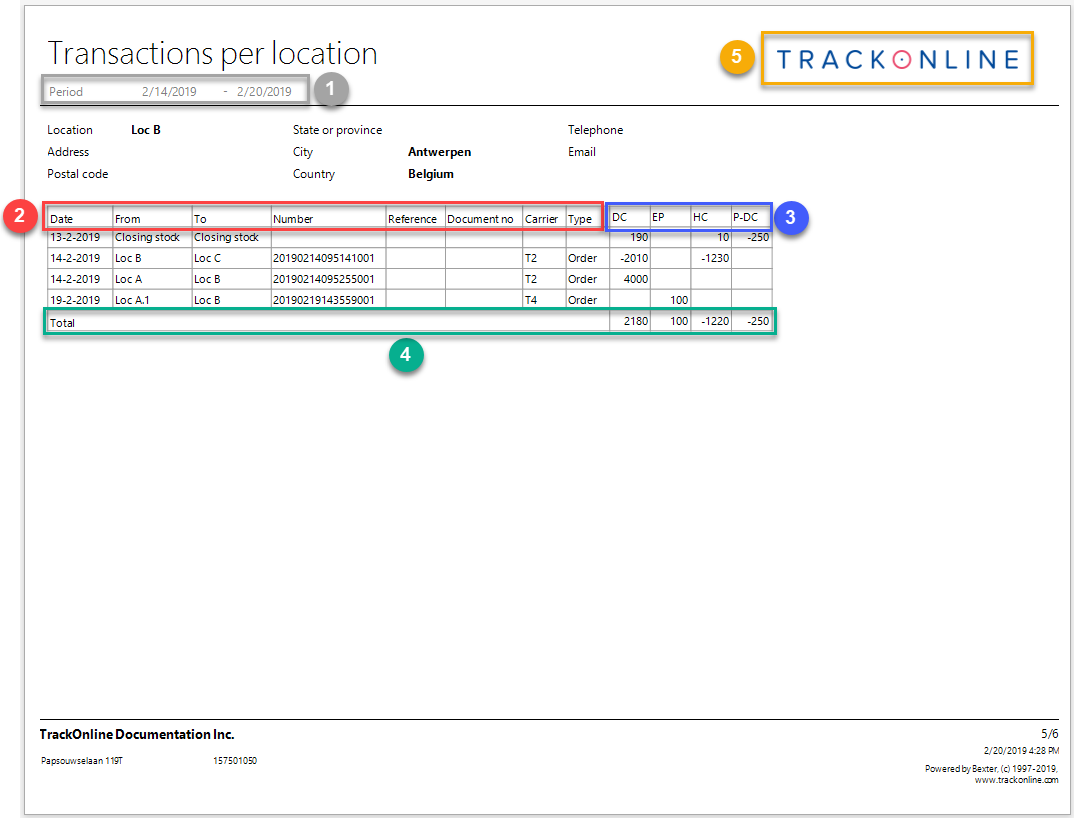
In the image 'Example report - Transactions per location' you see several frames, marked with a number. Every number will be explained in detail below:
- Period: Here you can see the period of which time this report has been generated. In this case consists the report out of transactions between 2/14/2019 - 2/20/2019 (month/day/year) for the location 'Company location'.
- General headers: This frame indicates some general headers, such as the from and to location, the transaction number, document number, which carrier carried out this transaction and the transaction type.
- Item names: Here you can see the names of the items that were part of the transactions.
- Total: This line indicates the total amount of items at this location, for this period.
- Logo: Currently you are seeing the logo of TrackOnline in this frame. Note that you can put your own company logo here, via 'Configuration' > 'Administration settings' > 'Company logo'.